In order to perform a detailed research, we setup two different test environments for Joomla!:
- Environment #1: a Joomla! clean installation with only the sample data.
- Environment #2: a Joomla! live site with real live data on the database. To be more specific, we have cloned this site for that purpose: we have got VirtueMart as the e-commerce solution, Ambra subscription as the renewal system, the Kunena forum to provide support, and K2 to handle the News & Announcements section, bog-style.
As the purpose of the research is to determine what good recomendations we can come up with for Joomla! and Joomla! extensions development, in both Environments we have installed our most powerful reporting system: SALES ANALYTICS for reports on VirtueMart sales, filled up with almost real data of 707 orders spread over a period of 707 days (101 weeks).
To get the bulk data for analysis we have used the embedded DEBUG feature inside Joomla! itself. This DEBUG systems retrieves information about response times and memory usage in five different Joomla! segments:
- Load: the actions required to load the server environment.
- Initialization: the actions required to get the request to the Joomla! core.
- Route: the actions required to take the request to the suitable component handler.
- Dispatch: the actions required by the component to build the page content.
- Render: the actions required to display the actual HTML response to the requester.
To test the front-end we have chosen to measure the home page behaviour, because this is generally the most visited page on every site. To test the back-end for reference we have chosen the control panel, where no specific functionality is generally loaded. And to measure the Joomla! extensions we have chosen SALES ANALYTICS with almost real data of 707 orders spread over a period of 707 days (101 weeks).
As sales report, we have selected to analyze the income report for all the 707 orders, over the 101 weeks period, displayed on a week by week basic for all the 9 main sales report parameters: gross income, net income, taxes, shipping costs, shipping taxes, # orders, # items, coupon discount and order discount. That report tyoe requires sum, accumulate, group, and display a matrix of 909 values and a linear graph of 101 points calculated from a database of nearly 6400 values. We have chosen this report type because it is the most demanding from the processing and rendering point of view.
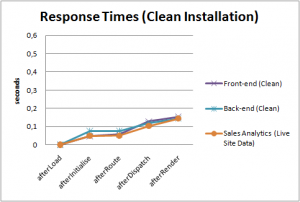
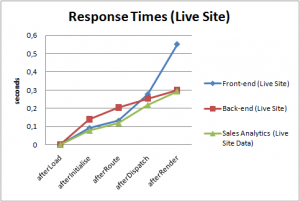
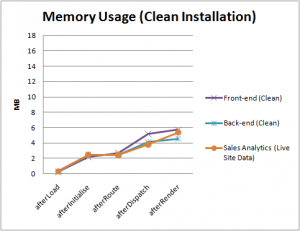
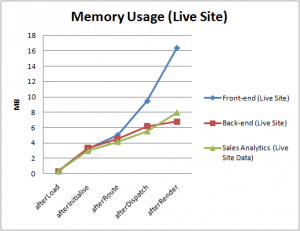
With this environment setup, over a series of executions, this is the bulk data that's got for further analysis:
This information is going to be analyzed in further detail, but a few outstanding tendencies can already be pointed:
- There is a big overhead in a Live Joomla! Website, compared with a Clean Joomla! Installation.
- And among all the element analyzed, specially the front-end performance rapidly degrades on a Live website.
To get the most out of it, we are going to analyze this data step-by-step to understand where and how we can improve performance and scalability.


